What Is a Pullback in trading? Pullback vs Reversal Explained
Price stalls. It drifts 15, then 20 pips against the trend you’re holding, and you have about four candles to decide something: add to the position, or get out. Guess right and you just bought a discount inside a trend that isn’t finished. Guess wrong and you just added risk to a trade that’s already over. that’s what is a pullback is all about.
That four-candle decision is what is a pullback comes down to in practice, not the dictionary version most traders already half-know. One side of that decision is a short pause against the dominant trend, expected to survive it. The other is the trend ending outright. For the first several candles the two look identical on a chart, and what is a pullback compared with a genuine trend change comes down to one test — not a gut feeling, and not the advice on most stock-market glossary pages, because that advice is built around volume data spot forex simply doesn’t have.
Direct answer — what is a pullback? A short, structure-respecting pause against the prevailing trend: price retraces part of the last move without breaking the trend’s swing structure, then resumes. The alternative breaks that structure outright — a lower high in an uptrend, or a higher low in a downtrend, confirmed by a closed candle. That structural break, not the size or speed of the move, is what separates the two.
What Is a Pullback
The first step in answering what is a pullback is ruling out what it isn’t. It is not a fixed percentage. Plenty of glossary pages claim a 5-to-10-percent move qualifies, or that anything beyond a 61.8 percent Fibonacci retracement stops counting and starts counting as a genuine trend change. Those numbers come from equities research and don’t transfer cleanly to currency pairs, where an average daily range is a few dozen pips and a “10 percent move” would mean price cutting a trend in half.
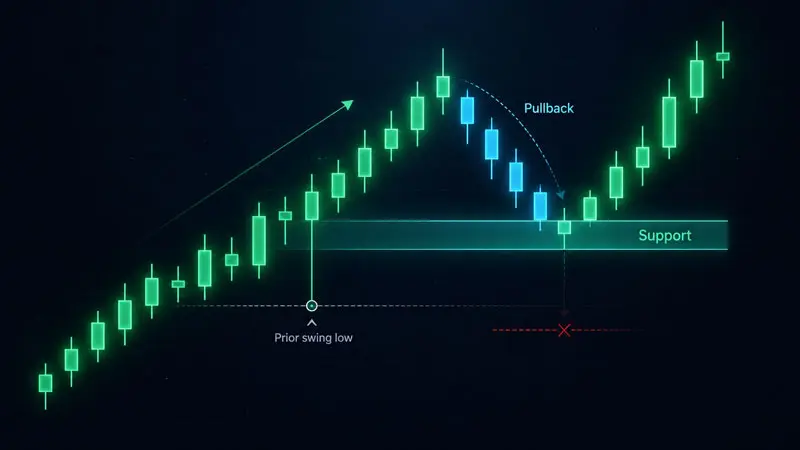
The useful version of what is a pullback: a retracement that respects the market’s existing swing structure, the foundation nearly all pullback trading rests on. In an uptrend, that low stays above the prior swing low; the higher-low sequence defining the trend is still intact. The moment it breaks below the prior swing low, the structure that defined it is gone, and what’s left needs a new label.
The word gets used interchangeably with “retracement” across most trading sites, and structurally that’s harmless. But pullback vs retracement is worth separating in one respect: retracement usually describes the percentage given back, while the behavior itself — what is a pullback in the fullest sense — describes the pause that produced it. A 40% retracement can still be healthy if the swing structure holds — the percentage alone doesn’t decide it.
The Test That Actually Separates Them
Most guides answer what is a pullback versus a genuine reversal by pointing to volume: a shallow move runs on light volume, a real trend change arrives on a spike. That’s a useful signal on a centralized exchange. Spot forex is decentralized — there’s no single volume figure; the number your platform shows is tick volume from one liquidity provider, not global participation. Leaning on it to settle pullback vs reversal in FX means building your read on data that doesn’t mean what it claims to mean.
The forex-appropriate test is structural, from smart-money concepts: BOS and CHoCH. A Break of Structure confirms the existing trend is continuing — price closes beyond the prior swing high in an uptrend, exactly what a healthy pause resolves into. A Change of Character is the opposite signal: the market fails to make a new high, then breaks the most recent higher low.
That failure is the tell, and it’s the cleanest answer to what is a pullback that FX structure can give you. Until CHoCH prints, the read holds. Once it prints, you’re looking at the start of a genuine reversal — holding an add-on position because “it’s just a pause” is how a normal losing trade becomes a much larger one, which is exactly the failure mode prop trading evaluations are least forgiving of.
Where a Real Pullback Should Stop
Part of answering what is a pullback correctly is knowing where it should stop, not just recognizing that it’s happening. It doesn’t retrace to a random level — it stops at a level with a reason behind it. The 50-period and 200-period moving averages act as dynamic support and resistance zones in a trending market, and price frequently pauses there before continuing. Fibonacci retracement levels mark the same idea numerically: the 38.2% and 61.8% levels of the prior swing are where a large share of pullback trading activity concentrates, because enough participants are watching the same numbers that the level becomes partly self-fulfilling.
An order block — the last opposing candle before an impulsive move — is a third magnet for this kind of pause, marking where large resting orders likely filled. When price drifts back into an unmitigated order block and reacts there, that’s a stronger case than a random-distance stop — one of the more reliable confluences in pullback trading. None of these levels guarantee a hold. What they give you is a reason to expect one, instead of guessing at a round number.
Reading the Candles at the Level
Once price reaches a level that could hold, the candle itself tells you whether it did — often the clearest real-time answer to what is a pullback you’ll get before structure confirms it. A Heiken Ashi chart smooths out the noise here better than a standard candlestick — a genuine pause shows small-bodied, indecisive candles with little directional conviction, while a real trend change shows strong-bodied candles pushing hard against the prior trend. The tightest version of a level worth watching shows up in a fair value gap: price often retraces specifically to fill an imbalance left by the impulsive leg, then resumes in the original direction. The distinction between the two is speed and conviction, not size. One drifts. The other pushes.
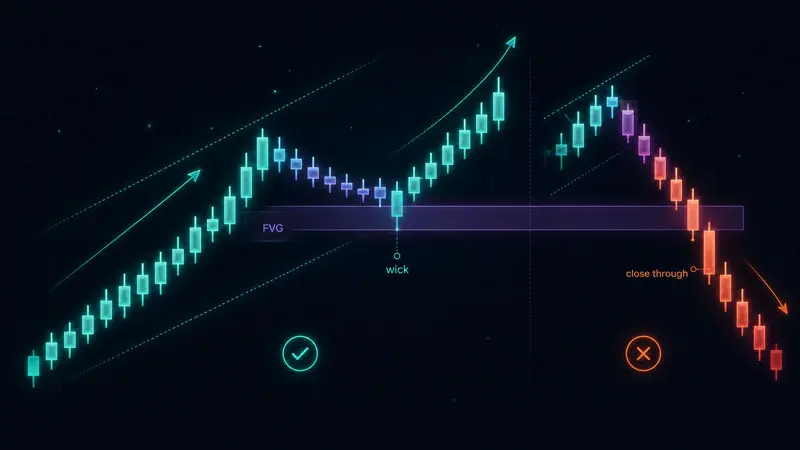
Watch for the close, not the wick. A candle that spikes through a level intracandle and closes back on the trend side is still consistent with a healthy pause — the kind of read pullback trading depends on getting right before size gets added. A candle that closes decisively through the level, especially with a full body, is the market telling you the level didn’t hold. This is the same logic behind price channels: the boundary matters, but the close through it is the actual signal, not the touch.
When News Turns the Read
A structural pause can turn into a genuine reversal the moment a fundamental catalyst arrives, which is why what is a pullback on Monday can be something else entirely by Wednesday — a risk pullback trading strategies rarely price in. CPI news that beats or misses expectations by a wide margin can invalidate a level that had held cleanly for days, because it changes the underlying reason participants were defending that price. The same applies to central bank decisions and any other high-impact release on the calendar.
The practical rule for trading forex news: if you’re still working out what is a pullback and what is a compromised trade going into a scheduled release, treat the position as compromised until after the print, not before. A setup that was purely technical five minutes ago can become fundamentally driven the moment the number hits the wire, and technical structure alone won’t tell you which way a surprise number breaks.
Trading a Confirmed Pullback
Once you’ve confirmed what is a pullback rather than the early stage of a real reversal, and the candle at the level closes in your favor, the entry itself is straightforward. This is where pullback trading earns its reputation as a lower-risk way to enter an established trend — good pullback trading is patient trading. A pending order — a buy limit at the level in an uptrend — removes the need to watch every tick and forces the level decision to be made in advance, when you’re not staring at a moving price.
The stop goes beyond the structure that would invalidate the read: below the swing low it needs to hold, not at an arbitrary pip count. This structural approach to entries is close to the zone logic used in the RTM trading strategy, where the entry zone is defined before price arrives, not improvised once it does.
Position Sizing When You Add
Adding to a position mid-trend means you’re increasing risk mid-trade, and that only works if the added size is calculated the same way the original entry was — from the stop distance, not from conviction, because what is a pullback on the chart is still real risk on the account. The formula stays constant: account size × risk percentage ÷ (stop distance in pips × pip value) = position size. A forex lot size calculator handles the arithmetic, but understanding why pip value shifts by pair matters more once you’re sizing a second entry against an account that already has open risk on the books.
On a PropLynq One-Step challenge, the daily loss limit is 3% and the max drawdown is 5% on a $100,000 account — $3,000 and $5,000 respectively. This is where what is a pullback stops being an academic question and starts being an account-preservation one.
If the original entry already used 1% risk ($1,000) and the add-on uses another 1%, that’s $2,000 of the $3,000 daily budget committed before the trade has even worked. If the level fails and both legs stop out, two-thirds of the day’s entire allowance is gone on a single misread. Sizing the add-on at 0.5% instead of a full 1% keeps a genuine reversal from consuming the whole daily limit in one move.
Common Pullback Mistakes
Most mistakes here aren’t about misreading what is a pullback on the chart — they’re about what happens after, and undisciplined pullback trading punishes that far more than a wrong initial read does. Revenge trading after a failed entry pushes traders to re-enter immediately at a worse price, chasing the loss instead of waiting for the next valid structural signal. FOMO works the other direction: seeing one setup resolve cleanly makes the next ambiguous dip look like an obvious add, when the structure hasn’t actually confirmed anything yet.
The worst version of this compounds. Martingale strategy traders add to losing positions on the theory that any drawdown will eventually resolve in their favor because “it’s just a dip.” Sometimes it does. When it doesn’t, position size has been doubling into a confirmed reversal the entire way down, and there’s no stop distance calculation that saves an account built on that assumption.
This treats what is a pullback as an excuse instead of testing it as a structural claim — the opposite of disciplined pullback trading. Every add-on needs its own stop and its own sizing, never an increase in size simply because the account is already underwater on the position.
Pullbacks Inside a Funded Account
The consequence of misjudging what is a pullback is different in a funded account than in a personal one, because a personal account has no fixed daily budget — a bad trade is just a bad trade. A funded evaluation does have that budget, and static vs trailing drawdown mechanics decide how harshly a wrong read gets punished. Under a trailing structure, every point of unrealized gain given back on a failed add-on quietly drags the drawdown floor along with it, shrinking the room to operate on the very next trade.
This is one of the reasons the best trading styles for prop challenges tend to favor fewer, better-confirmed entries over frequent discretionary adds. A trader who only adds once BOS confirms and a level closes cleanly is spending challenge risk on structurally justified trades, not on every dip that could plausibly answer what is a pullback in hindsight.
If you’ve settled what is a pullback for your setup and want to trade it against real capital with clearly defined risk parameters, you can get a funded account and apply this structure inside an evaluation.
The Short Version
That’s what is a pullback, stripped to the one test that matters: it holds structure. A genuine reversal breaks it. Wait for BOS to confirm the trend before treating a dip as a buying opportunity, and treat a confirmed CHoCH as your exit signal, not a level to average into. Everything else — the moving average, the Fibonacci zone, the order block, the candle close — is just evidence toward that one structural question. Get the structural read right, and the add-or-exit decision stops being a guess.
Miles Rowan Keene
As Senior Market Strategist at PropLynq, I write about market structure, trading psychology, and risk-first execution. My focus is on turning complex market behavior into clear, actionable lessons for both developing and experienced traders. I specialize in educational content covering funded account rules, drawdown management, trade planning, and strategy refinement, with the goal of helping traders build consistency through discipline, preparation, and a deeper understanding of how professional trading environments operate.
Weekly Trading Insights
Market analysis and trading tips delivered every Monday. No spam, unsubscribe anytime.
Comments
All comments are reviewed before publication · Text only · No links
No comments yet — be the first.