How to Trade Price Channels

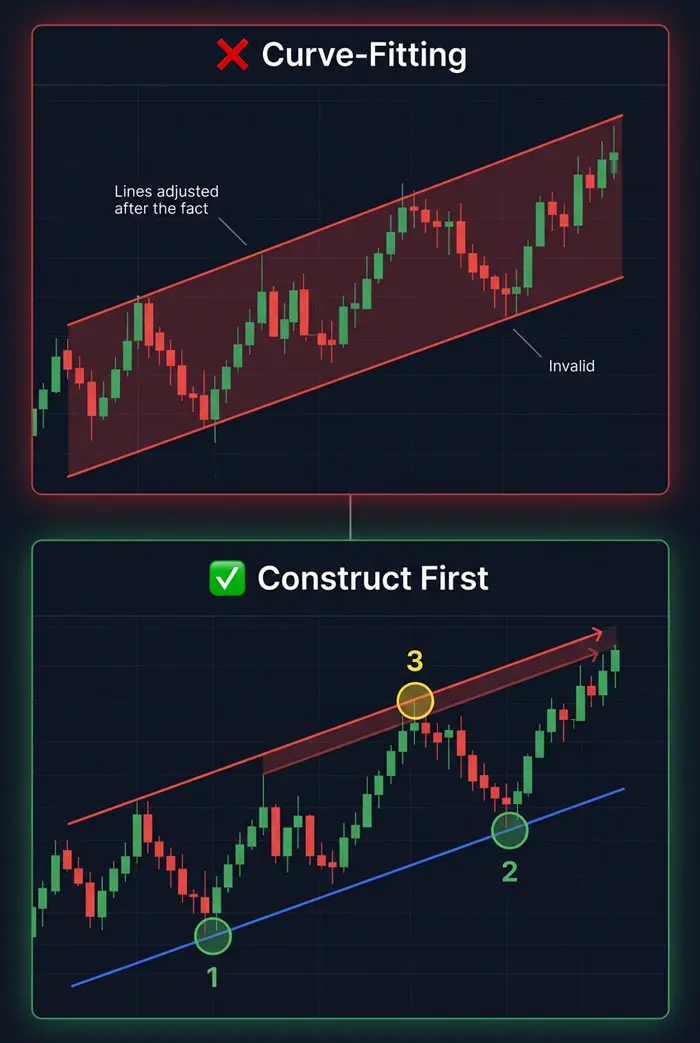
Draw the base trendline first. Then project the channel from it. That one discipline — construct first, fit second — separates a valid price channel from noise dressed up as a pattern. Most guides on how to trade price channels skip this distinction entirely, which is why most traders end up with curve-fitted channels: two lines adjusted after the fact until price sits neatly inside them. The problem isn’t the lines. It’s the process. When you retrofit a channel around existing price action, the boundaries describe what happened. They say nothing about what happens next. That is why how to trade price channels starts with construction discipline, not visual cleanup.
Done correctly, learning how to trade price channels gives you something rare in technical analysis: a defined entry zone, a logical stop placement, and a measured target — all built into the structure itself. You know the trade before price reaches the boundary. You don’t improvise when it gets there.
This guide covers the complete method for how to trade price channels: how to identify and draw valid ascending, descending, and horizontal channels; how to trade the interior bounce and the breakout; exact entry, stop, and target rules for each setup; and how to size positions inside channels without violating risk limits.
Direct answer: Price channel trading means buying near the lower boundary and selling near the upper boundary of a parallel channel structure, or taking a directional trade when price breaks out. A valid channel requires two confirmed pivot points on the base trendline and a parallel line from the opposite extreme, that’s how to trade price channels. The channel’s geometry defines both the stop and the target before the trade is placed.
What Is a Price Channel in Trading — and How to Trade Price Channels?
A price channel is a pair of parallel trendlines that contain a trend’s directional movement. The lower trendline connects the swing lows; the upper line connects the swing highs. When those swing points are rising, the channel slopes upward. When they’re falling, it slopes downward. When they’re level, the channel runs flat. In practical terms, how to trade price channels means reading those parallel boundaries as a trade plan, not just a drawing tool.
The geometry encodes something meaningful. A market moving inside a channel is making directional progress at a consistent rate — each swing up reaches roughly the same distance from the base, and each pullback holds roughly the same depth. That consistency is the core assumption behind the strategy: the market will continue respecting those boundaries until it clearly stops doing so.
A price channel has two structural components:
- Base trendline: the line that defines the direction. In an ascending channel, this connects the higher lows. In a descending price channel, it connects the lower highs. In a horizontal channel, it connects the lows of the range.
- Price channel line: the parallel copy of the base trendline, shifted vertically to pass through the opposite extreme — the swing highs in an ascending channel, the swing lows in a descending price channel. This is the far boundary, the level where price is expected to stall.
For that reason, how to trade price channels depends on the base trendline being fixed before the opposite line is projected.
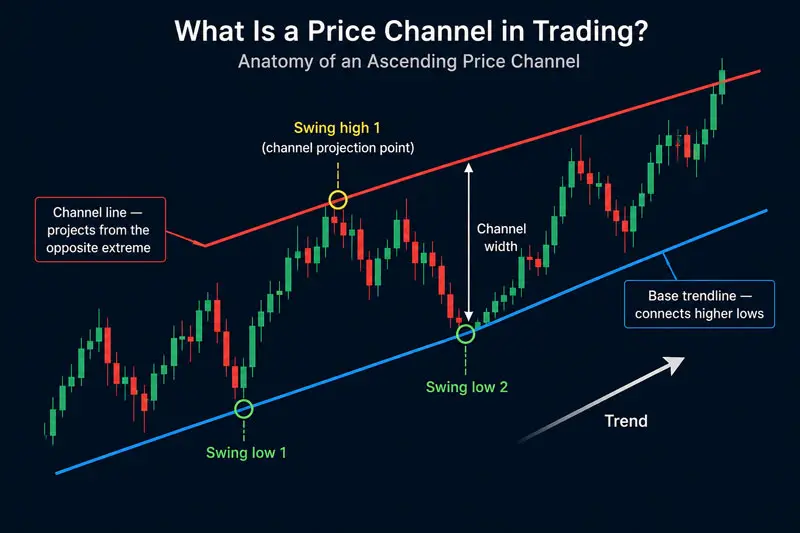
The distance between the two lines is the channel width. It determines your targets and your stop distances, which in turn determine your position size. A narrow channel produces tighter stops and larger position sizes for a given risk amount. A wide channel does the opposite. Neither is inherently better — they’re different risk parameters for different market conditions.
Channel trading is one of the more practical approaches in prop trading because the method generates a complete trade plan before price reaches the entry zone: entry level, stop placement, and target are all visible from the channel’s structure.
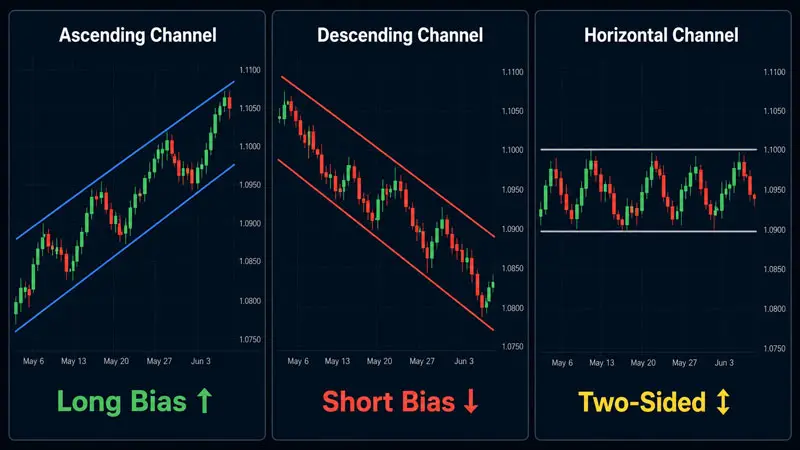
The Three Types of Price Channels
Each channel type describes a different market condition and carries a different probability weight for entries on each boundary. Knowing the type matters because how to trade price channels changes with trend direction.
Ascending channel. Price makes higher highs and higher lows. The base trendline connects the higher lows; the channel line above connects the higher highs. The trend is bullish. High-probability setups are longs from the base trendline, targeting the upper line. Shorts from the upper boundary are counter-trend — they can work, but they carry a lower probability baseline because you’re trading against the established direction. This is how to trade price channels with trend alignment: buy weakness at support, do not fade strength blindly.
Descending channel. Price makes lower highs and lower lows. The base trendline here connects the lower highs — the upper boundary of the channel. The channel line below connects the lower lows. Trend is bearish. The high-probability setups are shorts from the upper trendline, targeting the lower line. Longs from the lower boundary are counter-trend. For bearish structure, how to trade price channels is the mirror image — sell rallies into resistance and avoid buying weakness unless the reaction is exceptional.
Horizontal channel. Price oscillates between two roughly flat levels. Also called a range or a rectangle. The base trendline connects two or more similar lows (support); the channel line connects two or more similar highs (resistance). Both directions are structurally valid here — longs from the lower boundary, shorts from the upper. There is no directional bias, so neither side has a built-in edge over the other. Inside a flat range, how to trade price channels becomes a support-and-resistance exercise rather than a trend-following exercise.
One thing most price channel trading guides omit: the probability weight at each boundary is not 50/50 across all channel types. In ascending and descending channels, the boundary aligned with the prevailing trend direction holds the higher-probability trade. Entries from the counter-trend boundary carry a higher failure rate by default. That probability imbalance should affect not just your trade selection but your position sizing — smaller size for counter-trend channel trades, full size for trend-aligned bounces.
How to Trade Price Channels Without Curve-Fitting
The construction sequence is what most traders get wrong. Reverse it and you produce a curve-fitted channel. Follow it and you produce a structural edge. If you want how to trade price channels to have forward value, the base line must be drawn before the opposite boundary is projected.
Step 1: Identify two confirmed pivot points for the base trendline.
For an ascending channel, you need two higher lows — two distinct swing lows where price reversed upward and made a subsequent new high. Not approximations. Two cleanly separated swing lows with identifiable candle structures. A swing low is confirmed when price has moved clearly away from it in the expected direction. If you’re still unsure whether the candle is the low or if price might extend further, it hasn’t confirmed yet — wait.
Step 2: Draw the base trendline through those two points.
The line is now locked. Both pivot points are fixed. You do not adjust this trendline to accommodate subsequent price action. If price breaks through it decisively, the channel is invalidated — not adjusted. This rule is central to how to trade price channels without retrofitting the chart after every new candle.
Step 3: Find the primary swing high between or after those two lows.
This is typically the most prominent swing high that formed between your two base trendline pivots, or the first significant high after the second pivot. It doesn’t need to be the absolute highest point on the chart — it needs to be the cleanest, most obvious swing high within the move.
Step 4: Draw a parallel copy of the base trendline through that swing high.
The channel line is a copy of the base trendline, shifted vertically to pass through that swing high. Same slope, same angle, different position. You don’t draw two separate lines and check visually if they look parallel. You copy and shift. The channel line is a function of the base trendline — it cannot exist independently of it. That copy-and-shift process is how to trade price channels with geometry instead of guesswork.
The curve-fitting trap in detail. Curve-fitting happens when a trader draws two approximate lines and then adjusts both until price sits inside them neatly. Every time price extends slightly beyond a boundary, the line moves to accommodate it. The result looks like a channel in hindsight but has no predictive power going forward. You built it by accommodating every deviation, so every future deviation will break it.
A properly constructed channel may not contain every wick. Price is allowed to spike briefly through a boundary — what matters is whether the candle closes outside it. If you’re adjusting the trendline every time a wick escapes the channel, you’re curve-fitting.
Minimum confirmation before trading. After the initial construction (two points on the base trendline, one on the channel line), wait for at least one more live touch of either boundary before entering. Three total touches — two on one line, one on the other — is the minimum viable channel. A channel that has only its construction points and no confirmed subsequent reactions hasn’t proven itself yet. For live execution, how to trade price channels requires a reaction after construction, not just the construction itself.
How to Trade Price Channels Inside the Range — Bounce Trades
The bounce trade is the core price channel setup. Price approaches one boundary and reverses toward the other. This is usually the first practical answer to how to trade price channels because the trade path is visible before entry. You enter near the boundary, place a stop beyond it, and target the opposite channel line.
The entry rule: wait for a close, not a touch.
Do not enter the moment price reaches the trendline. Wait for a candle to close confirming the reversal. In an ascending channel, the sequence is:
- Price descends toward the base trendline.
- A bullish candle forms — ideally with a wick that tagged the trendline and a body that closed above it.
- Enter on the open of the next candle after that bullish close.
This rule filters a significant number of false touches — situations where price spiked through the trendline intracandle and kept falling. The close is the confirmation. The close is where how to trade price channels becomes objective instead of emotional. Using pending orders — specifically a buy limit placed just above the channel boundary — is a cleaner alternative that removes the need to watch every tick in real time. Set the limit at the boundary level and let price come to you.
Confluence at the boundary. The highest-probability bounce trades occur when the channel boundary aligns with a second structural reason to expect a reversal. A fair value gap that fills exactly at the channel trendline is one of the cleaner confluences — the FVG draws price to it, and the channel boundary provides the structural context for the reaction. When both align at the same level, the probability of a clean bounce increases meaningfully compared to a channel touch in isolation. That is how to trade price channels with confluence rather than relying on one diagonal line alone.
The stop rule. Place the stop below the low of the candle that touched the trendline for a long entry. If price undercuts that candle’s low, the bounce has failed — the structure did not hold. For short setups in a descending channel, stop goes above the high of the touch candle.
The target. The natural target is the opposite channel boundary. If you are still learning how to trade price channels, that opposite boundary should remain the default target. Set a limit order at the channel line above (for a long) and let price travel. For wide channels — more than 100 pips across in a forex major — consider taking half the position off at the channel midpoint and letting the remainder run to the full target. This locks in profit against the possibility that the channel narrows before price reaches the far side.
How to Trade Price Channels on Breakouts
When price exits a channel with a confirmed close beyond the boundary, the structure that contained price has ended. This is the second major answer to how to trade price channels: trade the failure of the structure, not only the bounce inside it. A new directional move typically follows — and it is often larger than any bounce trade inside the channel, because a breakout signals a shift in the market’s established rhythm.
What counts as a valid breakout. A candle body closing outside the channel. Not a wick, not a touch, not a spike that reverses within the same candle. The close is the signal. A body close on the other side of the trendline indicates the market accepted that level as the new price range, not just tested it.
A shift in market structure often precedes the actual trendline violation and provides early warning. The concepts covered in the BOS and CHoCH framework apply here directly: in an ascending channel, a lower high forming inside the channel before a downside break is a change of character that signals the channel is weakening before the line itself breaks.
The retest entry. After a breakout, price frequently returns to the broken trendline before continuing. This sequence — break, pullback to the broken level, continuation — is one of the most consistent technical patterns across timeframes and instruments.
A bullish breakout above an ascending channel’s upper line will often pull back to that line, which now acts as support. The entry is on confirmation at the retest, not on the breakout candle. For most traders, how to trade price channels on breakouts should mean waiting for the retest instead of chasing the first candle. Entering on the breakout candle directly means chasing a move that may be overextended and about to retrace. On the retest, your stop sits just back inside the channel. If price re-enters the channel after the retest, the breakout has failed — you’re out.
The measured target. For channel breakouts, the standard target is the channel width projected in the direction of the break. Measure the vertical distance between the two channel lines at the breakout point — that’s the width. Project that distance from the breakout level. Example: if a horizontal channel is 90 pips wide and price breaks above the upper boundary at 1.0850 on EUR/USD, the measured target is 1.0940.
The news caveat. Channel breakouts triggered by major economic releases carry a different risk profile than structure-driven breaks. A spike through a channel boundary on an NFP or FOMC announcement can reverse within minutes, trapping breakout traders. If a breakout coincides with a high-impact release, review the forex news trading principles before treating the move as a structural signal.
Stop Placement and Targets
Every channel trade uses the same principle: the stop marks the level where the setup is proven wrong, not a predetermined pip count. Here is the full decision table across all six channel setups:
| Setup | Entry trigger | Stop placement | Target |
|---|---|---|---|
| Ascending channel bounce long | Bullish candle close at base trendline | Below touch candle’s low | Upper channel line |
| Descending channel bounce short | Bearish candle close at base trendline (upper line) | Above touch candle’s high | Lower channel line |
| Horizontal channel long | Bullish candle close at support floor | Below support floor by ½ ATR | Resistance ceiling |
| Horizontal channel short | Bearish candle close at resistance ceiling | Above resistance ceiling by ½ ATR | Support floor |
| Channel breakout long — retest | Confirmation candle at broken upper boundary (now support) | Just inside the channel below the broken line | Channel width projected above breakout |
| Channel breakout short — retest | Confirmation candle at broken lower boundary (now resistance) | Just inside the channel above the broken line | Channel width projected below breakout |
One note on breakout stops specifically: because the stop sits just inside the channel, the stop distance can be very tight — a few pips in some cases. A tight stop is not an invitation to increase position size. Run the same position size formula regardless of how tight or loose the stop is.
Position Sizing: How to Trade Channels Without Breaching Risk
Channels have a practical advantage that most traders underuse: the setup defines the stop before you enter, which means position sizing becomes a direct calculation from the structure rather than a guess. This is where how to trade price channels connects directly to risk management instead of staying a chart pattern only.
The formula: position size = (account size × risk %) ÷ (stop distance in pips × pip value).
On a $100,000 account risking 1% per trade, the maximum loss is $1,000. If an ascending channel bounce on EUR/USD sets a stop 20 pips below the touch candle’s low, and each pip on a standard lot is worth approximately $10, the position is: $1,000 ÷ (20 × $10) = 5 mini lots (0.5 standard lots). Run this calculation before the trade, not while it’s moving. The forex lot size calculator handles this arithmetic instantly for any instrument and account size.
The wide-channel issue: wide channels produce large stop distances, and large stops produce smaller position sizes for the same risk amount. This is correct — don’t fight it. A 100-pip stop is not an error in your position size calculation; it’s an accurate reflection of how much certainty the setup provides. Inflating position size to compensate for a wide stop is one of the most common ways channel traders blow past their daily risk limits.
Channel trades and prop firm drawdown limits. On a prop firm challenge account, daily drawdown limits create a secondary constraint on top of per-trade risk. PropLynq‘s One-Step challenge sets a 3% daily drawdown limit — which on a $100,000 account is $3,000 per day. At 1% risk per channel trade, three consecutive losing trades in a single session would hit that ceiling exactly. In practice, channel traders on challenge accounts should target 0.5–0.75% risk per trade rather than the full 1%. This creates a buffer of four to six losing trades before the daily limit is reached, which is meaningful on volatile sessions where channels may produce multiple failed touches before price finds direction.
Understanding the distinction between static and trailing drawdown mechanics also matters here — the two systems compound differently under a losing streak. The static vs trailing drawdown article explains how each affects your usable equity as the session progresses.
What Invalidates a Price Channel
A channel is a live hypothesis, not a permanent structure. Markets shift, and a channel that was tradeable last week can become noise this week. Recognizing invalidation early prevents you from trading a broken structure.
A decisive close through the base trendline. In an ascending channel, a candle that closes below the lower trendline and does not recover above it within one or two sessions has invalidated the channel. A wick that spikes through intracandle and recovers is not the same signal. The close is the confirmation. When the close happens, stop taking bounce entries from the old channel structure.
Multiple non-reactive touches. A valid channel sees price reach a boundary and build momentum in the opposite direction. If price tests the base trendline two or three times in quick succession without generating any meaningful reversal — grinding along the line rather than bouncing off it — the boundary is eroding. The next test is more likely a breakdown than a bounce. Exit any open trades in the direction of the channel and stand aside.
The order block caveat. Sometimes what looks like a channel boundary failure is actually a sweep of the trendline to fill an institutional order block sitting just beyond it. If a significant order block aligns with or sits just past the channel boundary, a brief violation may not be genuine invalidation — wait for the candle close before making that judgment.
The timeframe-age rule. Channels on lower timeframes — 15-minute, 1-hour — that have been intact for several weeks begin to lose precision. The original pivot points that defined the channel are now far in the past, and recent price action has introduced drift. Move to a higher timeframe to assess whether the structure still holds at the macro level, or wait for a cleaner reset before trading the channel further.
How to Trade Channels with Support and Resistance
Channels and horizontal support and resistance operate at different levels of analysis, but they intersect in a way that generates some of the highest-probability channel setups.
When a channel boundary passes through a significant horizontal level — a price zone that has acted as support or resistance multiple times in recent history — you have confluence. Two independent structural reasons to expect a price reaction at the same level. That overlap is a higher-quality setup than a channel boundary in isolation. More on how to identify and grade those horizontal zones in the support and resistance zones article.
The same logic applies with Fibonacci retracement levels. Because Fibonacci levels capture the proportional depth of pullbacks within a trend, they frequently align with ascending channel base trendlines — the 38.2% and 61.8% retracement of the previous swing often coincide with where the channel trendline sits at the time of a pullback. When a Fibonacci level and a channel trendline converge at the same price, the probability of a clean bounce increases.
A practical rule before entering any channel bounce: check whether the boundary aligns with a horizontal support/resistance level or a key Fibonacci level. If it does, that’s a setup worth full size. If the channel boundary is isolated — no other structural reason to expect a reaction — consider reduced size or wait for stronger candle confirmation before entering.
The complement applies to breakout targets too: if the channel width projects a target into a major resistance zone, the measured move may stall before being reached. Factor horizontal levels into your exit planning, not just the channel width arithmetic.
Get a funded account and apply these channel setups inside a structured evaluation environment — where the forced discipline around stop placement and position sizing tends to improve execution compared to unstructured retail trading.
Miles Rowan Keene
As Senior Market Strategist at PropLynq, I write about market structure, trading psychology, and risk-first execution. My focus is on turning complex market behavior into clear, actionable lessons for both developing and experienced traders. I specialize in educational content covering funded account rules, drawdown management, trade planning, and strategy refinement, with the goal of helping traders build consistency through discipline, preparation, and a deeper understanding of how professional trading environments operate.
Weekly Trading Insights
Market analysis and trading tips delivered every Monday. No spam, unsubscribe anytime.
Comments
All comments are reviewed before publication · Text only · No links
No comments yet — be the first.