How to Trade Support and Resistance Zones in 2026

“Buy at support, sell at resistance.” It’s the first rule most traders learn, and it’s the reason their stops keep getting clipped by a single wick right before price does exactly what they predicted.
The logic isn’t wrong. Support and resistance are real. The problem is that almost everyone draws them as a single, pixel-thin line — one exact price where the market is supposed to turn on a dime — and then parks a tight stop right behind it. Price trades a few pips past the line, triggers the stop, and reverses. The analysis was right. The execution killed the trade.
Support and resistance are zones, not lines. That one shift changes how you mark a chart, where you enter, and — the part nobody talks about — where you put your stop. And if you’re doing this in a funded account, where you put that stop is the difference between a normal losing trade and a blown daily loss limit. Most of the damage from prop trading evaluations doesn’t come from bad analysis. It comes from good analysis executed at the worst possible price.
This guide covers how to trade support and resistance the way price actually behaves: as bands of buying and selling pressure, not magic numbers.
What Support and Resistance Zones Actually Are
A support zone is a price area where buying pressure has repeatedly overwhelmed selling pressure and stopped a fall. A resistance zone is the mirror image — an area where selling repeatedly caps a rally. Think floor and ceiling, but a floor with thickness, not a painted stripe.
The reason it’s an area and not a price comes down to how the turns are actually made. The orders that reverse a market aren’t sitting at one exact number. A fund or bank building a position fills across a range — a few pips on an intraday chart, sometimes a much wider band on the daily. That range is the zone. The cluster of resting institutional orders that creates these turns is what smart-money traders study as order blocks, and it’s the same underlying force that makes a support or resistance area hold.
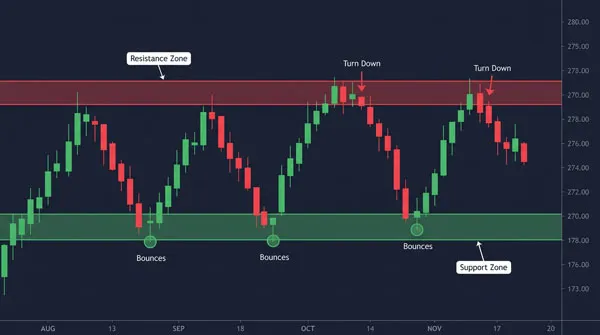
Three things give a zone its power. First, clustered orders — limit buyers and sellers stacked through a price band. Second, price memory — traders remember where the last reaction happened and act on it again. Third, self-fulfilling behaviour — everyone is watching the same area, so reactions concentrate there. That third point has a sharp edge to it: because the whole market sees the same level, stops pile up just beyond it. That detail is exactly why your stop keeps getting taken, and we’ll come back to it.
Horizontal vs Dynamic Support and Resistance
Everything so far describes horizontal support and resistance — flat zones drawn from prior highs and lows. But price also respects levels that move, and ignoring them leaves half the picture out.
The two you’ll meet most are trendlines and moving averages. In a clean uptrend, a rising trendline connecting the swing lows acts as dynamic support — price keeps pulling back to it and bouncing. A moving average does the same job: the 50 and 200 EMA frequently behave as dynamic support and resistance on higher timeframes, with trending price retracing to them before continuing. These aren’t a different concept; they’re the same order-clustering behaviour, just on a level that drifts with price instead of sitting still.
The rules don’t change. A trendline is a band, not a pixel-perfect diagonal — beginners draw one immaculate line through three wicks and then treat it as gospel, which is the line-not-zone error all over again, just at an angle. Wait for a reaction at the level, don’t trust the exact touch, and place stops beyond the zone. If anything, give dynamic levels a touch more room, because a moving reference is noisier than a fixed one.
Why a Support and Resistance Level Is a Zone, Not a Line
The single most expensive habit in trading support and resistance is drawing one line and trusting it to the pip. Markets don’t respect pips. They respect areas.
Here’s how to mark the zone properly. Use the candle bodies for one edge and the wicks for the other. The bodies show where price actually opened and closed — where the market accepted or rejected value. The wicks show how far each probe extended before getting rejected. The zone runs from the cluster of bodies to the extreme of the wicks. That band, not a single line, is your level.
Take a concrete case. EUR/USD prints three lows on the daily chart. The closes come in at 1.0850, 1.0848 and 1.0853 — tightly grouped. But the wicks stab down to 1.0835, 1.0831 and 1.0838. The line-drawer marks 1.0850 and tucks a stop at 1.0840. They get wicked out on every single retest, because the market routinely trades 15–20 pips below their line before turning. The zone-drawer marks 1.0830–1.0853 as the support zone, sees that the wicks reliably reach down to roughly 1.0830, and places the stop with that reality in mind. Same chart, same level, completely different outcome — driven entirely by line versus zone.
The lesson is simple: a zone tells you where the reaction happens and how much noise to expect inside it. A line gives you the first and hides the second. This is the same trap as treating a fair value gap as an automatic buy signal — a zone is a place to make a decision, not an instruction that fires the instant price touches it.
How to Identify Strong Support and Resistance Zones
Not every support or resistance zone is worth trading. The skill is telling a wall from a speed bump, and five factors do most of that work.
Number of touches. A support or resistance zone that has produced two or three clean reactions is validated; a single touch is provisional. But there’s a ceiling — a level tested too many times is weakening, because each test consumes the resting orders that made it strong. The fourth or fifth touch of a level is more likely to break than the second.
Timeframe. A zone drawn on the daily or weekly outranks one drawn on the 5-minute, every time. Higher timeframes involve more participants and more orders, so their zones carry more weight. Mark your major zones on high timeframes first, then drop down to execute.
Decisiveness of the reaction. A sharp, fast rejection — a long wick with strong follow-through — signals a real imbalance of orders. A slow, drifting turn is weak and unreliable.
Confluence. Ask whether the zone lines up with anything else: a round number, a prior swing point, a moving average, or a Fibonacci retracement level like the 61.8%. Stacked reasons make a stronger zone. One zone sitting on three independent signals is far more tradeable than a lonely line.
Psychological levels. Round numbers (1.1000 on EUR/USD, 2000 on gold) attract orders on their own and often reinforce a zone.
| Attribute | Strong zone | Weak zone |
|---|---|---|
| Touches | 2–3 clean reactions | 1 touch, or 5+ (exhausted) |
| Timeframe | Daily / weekly | 5-minute / 1-minute |
| Reaction | Sharp rejection, fast follow-through | Slow drift, no momentum |
| Confluence | Lines up with round number, Fib, swing | Stands alone |
Marking these cleanly is half the battle. A charting workflow where you drag a rectangle across the zone and carry it between timeframes keeps things readable — a good TradingView guide covers exactly this and stops your chart turning into a web of lines.
How to Trade Support and Resistance Zones
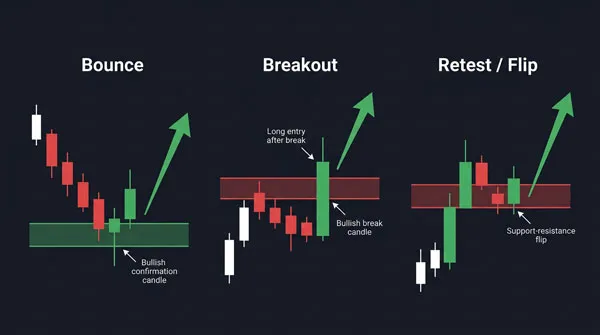
There are three honest ways to trade a zone — the bounce, the breakout, and the retest — and every one of them needs confirmation. None of them is “buy because price touched the line.”
The bounce. This is the range-reversion play: price returns to a support or resistance zone and you trade the rejection. The key is that you wait for the reaction, not the touch. Price entering the zone is not the signal; price entering the zone and printing a rejection candle — a pin bar, a bearish or bullish engulfing, or a clear shift on a lower timeframe — is the signal. Example: GBP/USD rises into a resistance zone at 1.2780–1.2800 and prints a bearish engulfing candle closing at 1.2772. You short the close, place the stop above the zone at 1.2812, and target the prior support around 1.2680. That’s roughly 40 pips of risk for 92 of reward — better than 2:1, with confirmation behind it.
The breakout. Here you trade price leaving the zone with force. The whole game is separating a real break from a fake-out. A real break is a decisive candle body closing beyond the zone, ideally with rising volume and immediate follow-through. A fake-out is a wick that pierces the zone and then closes back inside. Traders who chase the wick get trapped on the wrong side; traders who wait for the close don’t. This is the same structural idea as BOS and CHoCH in smart-money trading — the market isn’t just touching a level, it’s shifting its intent.
The retest, or flip. After a confirmed break, old resistance becomes new support and old support becomes new resistance. This is the cleanest entry of the three because the market has already shown its hand. You wait for price to come back to the broken zone and hold it. Example: gold breaks resistance at 2350 with a strong daily close, then pulls back into 2345–2350, holds, and prints a bullish reaction. You enter long off that hold with the stop below 2338 — a tight, logical risk because the zone has flipped and is now defending you instead of fighting you.
If you trade these areas as fresh-versus-tested supply and demand rather than static lines, the RTM trading strategy is worth studying — it formalises why a zone’s first test is usually its strongest.
Where to Put Your Stop (and Why the Line Is the Worst Place)
Your entry decides whether you’re in the trade. Your stop decides whether you survive it. On support and resistance, the stop is where most traders quietly hand their money back.
The cardinal error is placing the stop at the line, or just inside the edge of the zone. Remember that everyone draws the same level and clusters their stops in the same place. That cluster is a target. Price routinely probes just beyond an obvious level specifically because that’s where the stops are — call it a stop run or a liquidity grab, the effect is identical: you get filled out at the extreme, then watch the reversal happen without you.
The rule that fixes it: the stop belongs on the far side of the entire zone, plus a buffer for noise — never at the line. Size the buffer from the zone’s own behaviour. If the wicks in that support zone reliably reach 1.0830, your stop goes below 1.0820, not at 1.0840. An ATR-based buffer works too: add a fraction of the average range so normal volatility can’t reach your stop.
There’s a trade-off, and it’s the one traders dodge. A wider, safer stop means a smaller position to keep your risk constant — and that’s the correct order of operations. Place the stop where it survives, then size to it. Run it through a forex lot size calculator so the position is sized from the stop distance, not chosen first and forced to fit. Most traders do it backwards: they pick a position size they like, then jam the stop wherever keeps the dollar risk comfortable — which is almost always too close to the line. That habit is also why obvious levels punish you on fast moves with slippage on stop fills; sitting at the most crowded price is asking for the worst fill. If you trade at a prop firm, that crowded-stop habit doesn’t just cost you a trade — it spends a budget you can’t get back.
What Bad Trading Costs in a Funded Account
In a personal account, a wick-out is one losing trade. In a funded account, repeated wick-outs are a structural threat — because a daily loss limit and a max drawdown are fixed budgets that don’t refill when your analysis turns out to be right.
PropLynq, for example, structures its evaluations with clearly defined loss limits: the One-Step challenge runs on a 3% daily loss limit and 6% maximum drawdown, the Two-Step uses a 5% daily limit and 10% max drawdown, and the Rocket challenge is built around a 6% trailing drawdown. Those numbers turn sloppy stop placement into a measurable cost.
Work it through on the One-Step. On a $100,000 account, a 3% daily loss limit is $3,000 for the day. Risk a disciplined 1% — $1,000 — per trade. Take two setups where the analysis is correct but the stop sits tight at the line, and both get wicked before price turns. That’s $2,000 gone: two-thirds of the day’s entire budget, spent on trades you read correctly. Move those stops below the zone where the wicks can’t reach, size down to keep the dollar risk at 1%, and the same two setups likely cost nothing — because they’d have held.
The trailing structure makes it worse if you’re careless. With a 6% trailing drawdown, every gain you hand back to a wick-out drags your trailing threshold along behind you and quietly shrinks your room to operate. This is why zone discipline isn’t a stylistic preference inside an evaluation — it’s the mechanism that keeps you in the game. If you’re working toward an evaluation, treat stop placement as a core part of how to pass a prop firm challenge, not an afterthought.
Common Mistakes to Avoid
Most support and resistance losses trace back to a short list of repeatable errors. Run your own trading against it.
- Drawing a line instead of a support or resistance zone. A single price gives you false precision and a stop that lives in the noise.
- Entering on touch instead of confirmation. Price reaching the zone is an alert, not a trigger. Wait for the rejection candle or the structural shift.
- Placing the stop at the line. That’s where the whole market’s stops sit, which is exactly where price is drawn to probe.
- Treating a 5-minute zone like a daily zone. Lower-timeframe levels break far more easily; size and expectations should reflect that.
- Chasing the breakout wick. Jumping in before the candle closes beyond the zone is classic FOMO — wait for the close or the retest instead.
- Sizing first, fitting the stop second. Always place the logical stop, then size the position to it — never the reverse.
- Marking every minor reaction as a zone. A chart buried in lines is a chart you can’t read. Keep only the validated zones.
One practical fix for the chasing problem: instead of hovering over the buy button waiting for a touch, set a pending order at the zone — a buy limit or sell limit with the stop already placed beyond the band. It removes the emotional touch-chase and forces you to decide the levels in advance, when you’re thinking clearly.
The Shift That Changes Everything
Support and resistance work, and they’ve worked for as long as charts have existed, for one stubborn reason: traders keep clustering their orders in the same places. What fails isn’t the concept — it’s treating a band of pressure as a single number and then standing exactly where the crowd’s stops are waiting to be hit. Mark the support or resistance zone. Wait for the reaction. Put your stop where the noise can’t reach it, and size the trade to that distance. Do that consistently, and the setups that used to wick you out become the ones you’re still holding when price finally turns.
If you want to put this into practice against real capital with transparent, defined risk rules, you can get a funded account and trade these setups in a live evaluation.
Miles Rowan Keene
As Senior Market Strategist at PropLynq, I write about market structure, trading psychology, and risk-first execution. My focus is on turning complex market behavior into clear, actionable lessons for both developing and experienced traders. I specialize in educational content covering funded account rules, drawdown management, trade planning, and strategy refinement, with the goal of helping traders build consistency through discipline, preparation, and a deeper understanding of how professional trading environments operate.
Weekly Trading Insights
Market analysis and trading tips delivered every Monday. No spam, unsubscribe anytime.
Comments
All comments are reviewed before publication · Text only · No links
No comments yet — be the first.