Bitcoin 4 Year Cycle – Is It Real and Will It Break?

The bitcoin 4 year cycle has run the same way three times in a row. Thirty-five months of bull market. Twelve months of bear market. Three times, measured to the quarter.
The next one is going to be different.
Not different as in “maybe slightly shorter” or “institutional adoption might smooth it out” — the kind of noncommittal language you’ll find on every other site covering the bitcoin 4 year cycle. Different as in: the next cycle starting in Q4 2026 is likely to run two years of bull market and two years of bear market. The 3:1 ratio that has defined every completed Bitcoin cycle is going to invert to 1:1. That changes almost everything about how you should position for what comes next.
This article makes that case — using the exact historical data, the cross-market framework that explains why the bitcoin 4 year cycle exists in the first place, and the specific structural conditions that make the 2026–2030 cycle look unlike any of the three that preceded it.
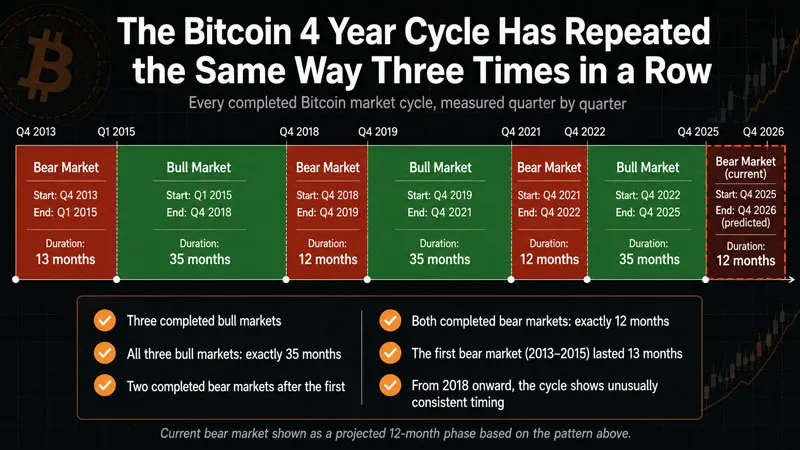
The Bitcoin 4 Year Cycle Has Repeated the Same Way Three Times in a Row
Here is every completed Bitcoin market cycle, measured quarter by quarter:
| Phase | Start | End | Duration |
|---|---|---|---|
| Bear Market | Q4 2013 | Q1 2015 | 13 months |
| Bull Market | Q1 2015 | Q4 2018 | 35 months |
| Bear Market | Q4 2018 | Q4 2019 | 12 months |
| Bull Market | Q4 2019 | Q4 2021 | 35 months |
| Bear Market | Q4 2021 | Q4 2022 | 12 months |
| Bull Market | Q4 2022 | Q4 2025 | 35 months |
| Bear Market (current) | Q4 2025 | Q4 2026 (predicted) | 12 months |
Three completed bull markets. All three: exactly 35 months. Two completed bear markets after the first. Both: exactly 12 months. The first bear, in 2013–2015, ran 13 months — Bitcoin was younger and the market thinner. From 2018 onward the bitcoin 4 year cycle locks in with a precision most financial markets don’t produce.
That’s not a rough four-year approximation. That’s 35 months of gain, 12 months of correction, repeated three times across entirely different market conditions — different price levels, different levels of institutional involvement, different global macro environments, different regulatory climates. The specific reasons each bull market ran changed completely. The duration didn’t move.
The ratio is 3:1. Three years building, one year correcting. That’s what traders who understand the bitcoin 4 year cycle have calibrated their approach around. And that’s the ratio that is likely to shift in the next cycle.
Why the 4 Year Pattern Exists Across All Major Markets
Most explanations of the bitcoin 4 year cycle begin and end with the halving: every four years, the block reward paid to Bitcoin miners is cut in half, new supply tightens, price rises. That’s accurate. It’s also incomplete.
The halving explains why Bitcoin has a supply-side shock every four years. It doesn’t explain why that shock produces a cycle of such consistent duration. For that, you need to look at a pattern that existed in global markets decades before Bitcoin was created.
Pull up a long-term chart of the S&P 500 going back to 1960. Stretch it all the way out. You’ll find the same rhythm: multi-year expansion periods followed by corrections, running in intervals of approximately four years. This isn’t a Bitcoin-specific phenomenon. It’s the US presidential election cycle.
Every four years, the United States elects a president. That election creates a predictable pattern in global liquidity. In the 12–18 months leading up to an election, incumbent administrations have strong incentives to make the economy feel strong. Fiscal spending increases. Monetary policy tends to become accommodative. Credit conditions loosen. Risk assets — equities, commodities, and, since Bitcoin became a major asset class, crypto — benefit from that expanding liquidity.
After the election, the cycle recalibrates. New administrations reset priorities. Central banks reassess. The liquidity tailwind fades. Markets consolidate or correct before the next expansion phase begins.
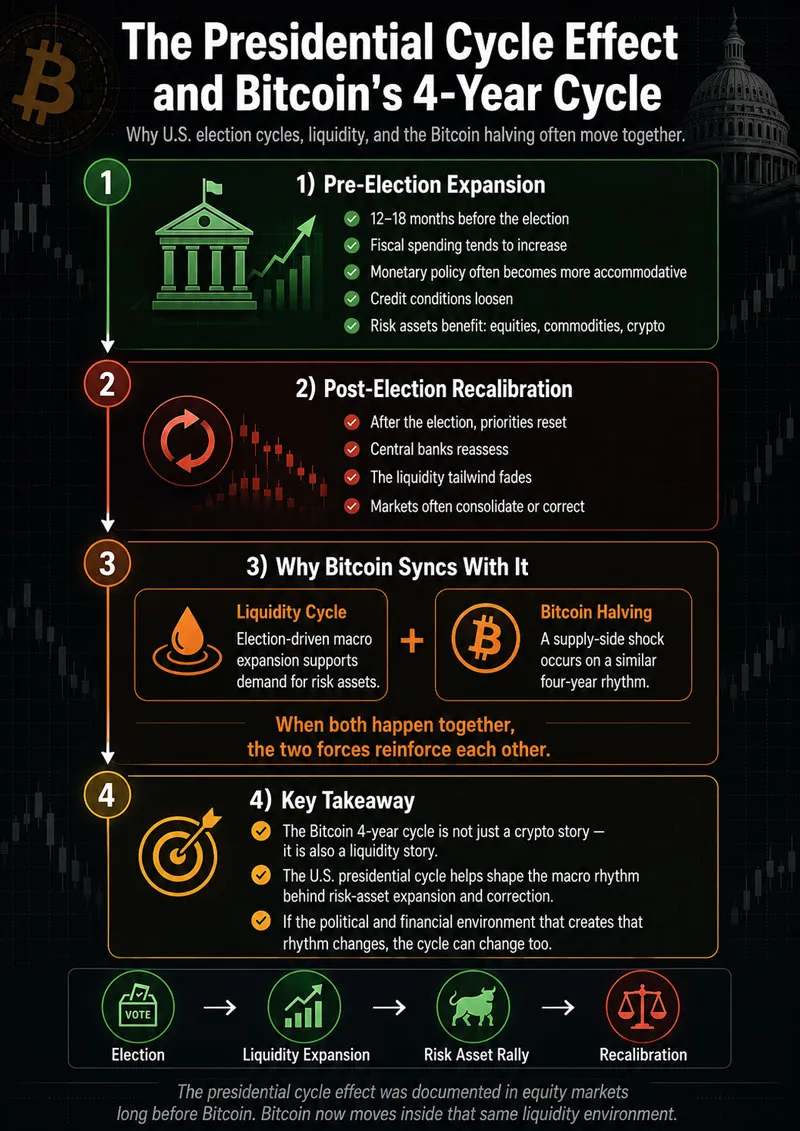
This “presidential cycle effect” was documented in equity research decades before anyone had heard of Bitcoin. It’s a structural feature of how capital moves in a four-year democratic rhythm. Bitcoin sits in this same liquidity environment. The halving — which also occurs approximately every four years — provides the supply-side shock that coincides with the macro expansion phase. The two forces reinforce each other.
This is why the bitcoin 4 year cycle is as consistent as it is. And it’s why, when the global political and financial environment that produces that four-year liquidity rhythm changes, the cycle changes with it.
Traders working in prop trading across equities, forex, and crypto are all operating in the same underlying four-year macro rhythm — the same rhythm behind the bitcoin 4 year cycle — whether they map it explicitly or not. Understanding how macro data like CPI shapes the liquidity environment that drives these cycles is directly relevant to reading where Bitcoin is in any given phase.
Left-Translated vs. Right-Translated — The Concept That Explains the Next Cycle
Every multi-year market cycle has a shape — a description of where its peak falls relative to the cycle’s total length. This concept is called cycle translation, and it’s the key to understanding why the next bitcoin 4 year cycle is likely to run differently from the previous three.
A right-translated cycle peaks in the second half of its duration. The bull phase is long. The bear phase is compressed. Every bitcoin 4 year cycle recorded so far has been right-translated: 35-month bulls, 12-month bears. The pattern is so consistent that it became the default assumption — the blueprint traders used when building their approach for the next cycle.
A left-translated cycle peaks in the first half of its duration. The bull phase is shorter. The bear phase is longer. Instead of 35 months building and 12 months correcting, you get something closer to 24 months building and 24 months correcting. The total cycle length stays roughly the same. The distribution of those months reverses.
Put it simply: in a right-translated bitcoin 4 year cycle, you have 35 months to ride the bull and 12 months to weather the bear. In a left-translated one, you have 24 months for each.
This distinction carries a practical consequence that most traders who’ve calibrated to Bitcoin’s historical pattern will feel immediately. Three consecutive right-translated cycles have trained Bitcoin traders to hold through early volatility, to resist selling “too early,” to wait for the late-cycle parabolic phase. That learned behaviour — which was the correct behaviour for the 2015–2018, 2019–2021, and 2022–2025 cycles — is exactly what a left-translated cycle punishes. A left-translated peak arrives when the right-translated investor is still expecting 12 more months of upside.
The bitcoin 4 year cycle hasn’t changed its duration. What changes is the shape within that duration. Reading structural breaks and changes of character on higher timeframes is one of the earliest tools for identifying whether the current bull is distributing early or continuing to a later peak.
Why the Next Bitcoin 4 Year Cycle Will Likely Be 2 Bull Years, 2 Bear Years
Three consecutive right-translated cycles: 35 months bull, 12 months bear. The next bitcoin 4 year cycle — beginning in Q4 2026 — is likely to be left-translated: approximately 24 months bull, 24 months bear.
That’s the prediction. Here’s why it’s built on structural reasoning, not speculation.
The global business cycle has been distorted.
Post-pandemic fiscal stimulus in 2020–2022 compressed what should have been a more gradual adjustment. Central banks worldwide raised rates at a speed not seen in decades, then reversed within tighter intervals than history suggested. The four-year liquidity rhythm — expansion, peak, contraction, recovery — ran accelerated and out of phase. When the underlying business cycle that drives global liquidity peaks earlier than the presidential cycle timeline would normally suggest, the expansion phase it produces in the following cycle is also truncated.
Political and financial conditions globally are structurally different from any prior Bitcoin cycle.
The 2026–2030 cycle begins with Bitcoin ETFs established, with institutional allocation frameworks in place across major economies, with regulatory clarity largely resolved in developed markets. The “new participant premium” that powered the sharp moves of prior cycles — where each bull market brought in an entirely new class of investor discovering Bitcoin for the first time — is structurally smaller now. Institutional capital enters and exits more methodically. It doesn’t produce the same extended parabolic runs that retail-dominated cycles did.
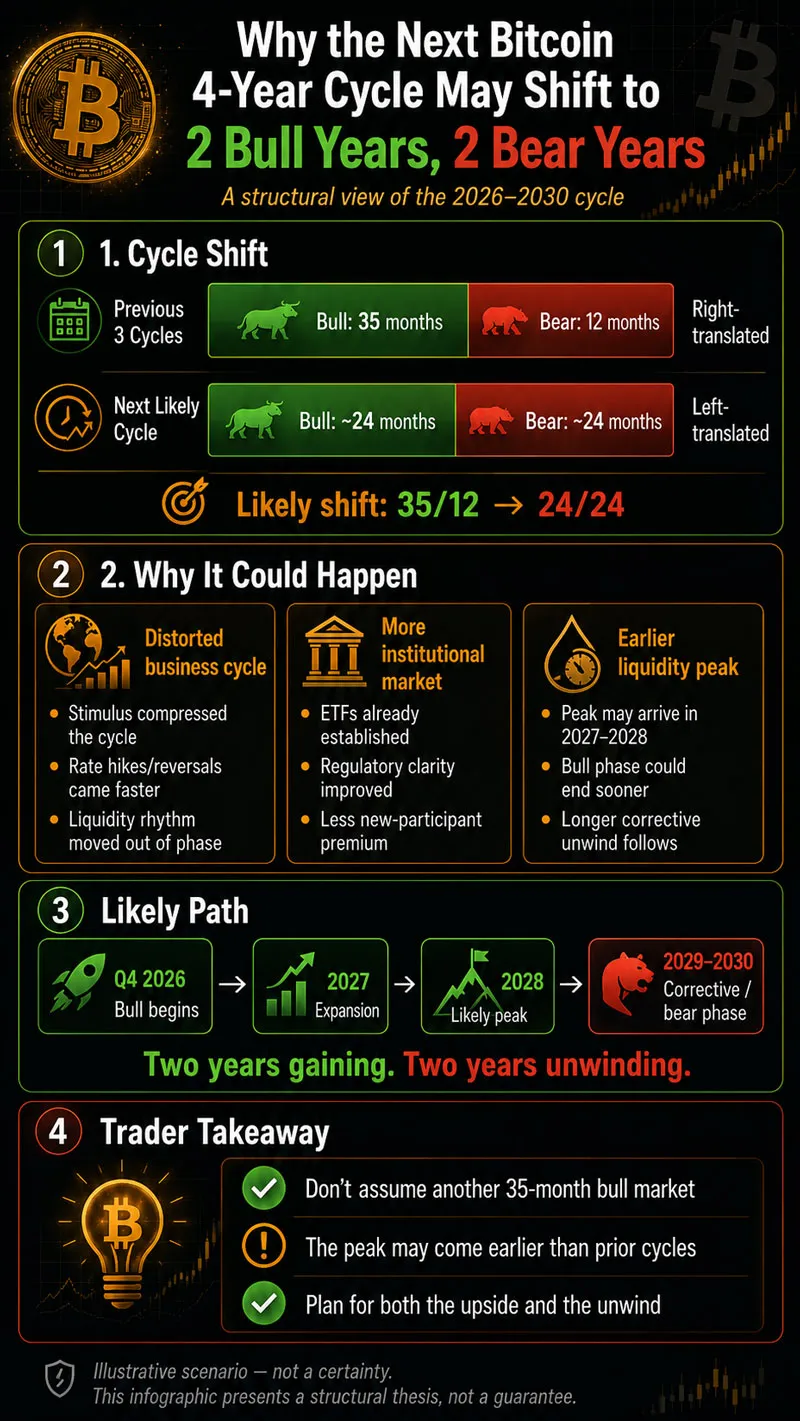
Extended business cycles shift the timing of the liquidity peak.
When the global business cycle has been stretched and distorted by post-crisis stimulus, its peak tends to arrive earlier relative to the standard presidential election timeline. That means the liquidity environment supporting the 2026–2030 Bitcoin bull may reach its apex in 2027–2028 rather than 2028–2029, cutting approximately one year from the bull phase and adding it to the corrective phase.
The result: a bull market starting in Q4 2026, peaking around 2028, and correcting through 2029–2030. Two years gaining. Two years unwinding. A trader who enters in Q4 2026 and applies the same holding logic as the prior three cycles — assume 35 months of bull, sell near the end — will be holding through the majority of a 24-month bear market before realising the peak passed in 2028.
For traders who want to work with Bitcoin’s cycle in both directions — long in the bull phase, short in the corrective phase — PropLynq allows Bitcoin CFD trading within its funded challenge environment, which means you can position for both sides without managing a crypto wallet or exchange account.
What This Means for Traders in the Current Bitcoin 4 Year Cycle Phase
By the bitcoin 4 year cycle clock, mid-2026 places us seven to eight months into the current 12-month bear phase that began in Q4 2025. The predicted inflection toward the next bull is approximately four to six months away.
That proximity matters. The clearest, most directional setups in any cycle tend to appear in its early phase — when trend is freshest and structure is cleanest. Waiting until the inflection is confirmed and obvious means entering a move that’s already well underway.
Take Marcus, a trader with a $50,000 Bitcoin CFD account. He’s not trying to pick the exact bottom. He’s building a decision framework for the next 36 months.
His approach: starting in Q3 2026, he watches for structural confirmation that the bear phase is ending — specifically, higher lows forming on the weekly chart, followed by a break above the key resistance level that has capped the current bear. He doesn’t add size until structure confirms. Once it does, he begins scaling in.
The part that’s different from prior cycles: Marcus has a pre-set exit framework calibrated to left-translation. If Bitcoin is making new all-time highs by late 2027 and begins showing distribution signs — weakening momentum on the monthly chart, volume divergence, lower highs forming on the weekly — he doesn’t wait for the expected year-three parabolic. He reduces exposure. In a right-translated cycle, that would have been early. In a left-translated cycle, that’s exactly the right call.
That’s what it looks like to use the bitcoin 4 year cycle as a framework rather than a calendar. The cycle tells you where the macro wind is pointing. Your technical analysis tells you when the wind is actually shifting.
The difference between these two traders — the one who uses the cycle as a calendar and the one who uses it as a framework — won’t show up in the first 12 months of the next bull market. It’ll show up in month 22, when the calendar trader is holding and expecting 13 more months of upside, and the framework trader is watching structure for signs that the peak has already formed.
Traders looking to get a funded account before Q4 2026 have one specific reason to start now: time. Evaluation periods take weeks to months, and the early phase of any cycle is precisely when you want capital already in place. For more on what prop firm evaluations look like and how to approach them, this guide covers the full process of how to get a funded traading account.
Where the Thesis Could Be Wrong
The bitcoin 4 year cycle has only three completed data points. Three is not a law. It’s a strong pattern with structural support — but structural support is not the same as certainty, and any trader who treats the bitcoin 4 year cycle as a guaranteed calendar rather than a probabilistic framework is setting themselves up for a lesson.
The left-translated prediction rests on a specific set of conditions: distorted global business cycles, structurally different political and financial environments, and reduced new-participant demand. If those conditions don’t play out as expected, the cycle could revert to its right-translated historical pattern.
What could extend the bull phase beyond 2028: a major liquidity event — a sovereign debt crisis driving capital into hard assets, a geopolitical shock creating sudden demand for non-sovereign stores of value, or a structural policy shift by a major economy that dramatically expands Bitcoin’s institutional base. Any of these could push the bull phase well past the left-translated scenario.
What the 2028 halving means: it will happen regardless of where the cycle stands. If the market is already in a bear phase by early 2028, the halving’s supply shock may act as a floor or trigger a secondary rally within what would otherwise be a bear phase. The interplay between halving timing and a left-translated cycle top is not simple or predictable.
The framework stays useful even when the exact prediction is wrong. Use it as orientation — not instruction.
Should You Trade the Bitcoin 4 Year Cycle?
The bitcoin 4 year cycle won’t hand you entries, tell you where to set a stop, or confirm when the exact top has formed. What it gives you is macro orientation: when the structural backdrop favours long exposure, when it favours caution, and when the historical pattern says the dominant trend is likely to shift.
Used at that level — as orientation rather than instruction — it’s one of the more reliable multi-year frameworks available for any asset class.
For charting Bitcoin across the timeframes where the bitcoin 4 year cycle actually shows up — monthly and quarterly — a proper multi-timeframe layout in TradingView is the practical starting point. And for identifying entry levels within each phase once the cycle turns, Fibonacci retracement levels drawn from major cycle highs and lows give you the most commonly respected price levels in the market.
The cycle gives you the map. A prop firm gives you the capital to act on it. The left-translated thesis gives you the warning not to confuse a 24-month bull for the 35-month version you’re used to. Put those three together — the bitcoin 4 year cycle as your macro map, funded capital as your tool, and the left-translated thesis as your early warning — and you have something worth trading around.
Miles Rowan Keene
As Senior Market Strategist at PropLynq, I write about market structure, trading psychology, and risk-first execution. My focus is on turning complex market behavior into clear, actionable lessons for both developing and experienced traders. I specialize in educational content covering funded account rules, drawdown management, trade planning, and strategy refinement, with the goal of helping traders build consistency through discipline, preparation, and a deeper understanding of how professional trading environments operate.
Weekly Trading Insights
Market analysis and trading tips delivered every Monday. No spam, unsubscribe anytime.
Comments
All comments are reviewed before publication · Text only · No links
No comments yet — be the first.